Celestial Wheels
This project draws a loopy curve, that mathematicians call an epitrochoid, and everyone else calls a spirograph pattern. It introduces the idea of an object and its methods.
Turtles, turtles, turtles
Start the project by making an empty file loo.py.
Right-click and open it with IDLE.
Type in the editor:
# Fun with epitrochoids
from turtle import *
In the introduction we used only one turtle,
and so your commands like forward and left,
went to that unnamed turtle.
Here you’ll create two other turtles,
and send your commands to each of them by name.
Let’s see how this works.
Save and run your program,
so the import happens and the shell opens.
This is how you make a new turtle,
and a variable ted to refer to it.
Try this in the shell window:
>>> ted = Turtle()
Now we can give ted the turtle some things to do:
>>> ted.color("blue")
>>> ted.left(60)
>>> ted.forward(100)
These instructions are just like function calls.
A function addressed to a particular object is called a method.
The dot . is how you address a method to an object in Python.
It has to be something the object knows how to do, so:
>>> ted.print()
raises an error.
print is a valid function,
but it is not a method of Turtle objects.
Setting up the guide turtles
We need two “guide” turtles, each of which draws a circle. Each has to be set up a certain distance from home, so add this function to your code:
def new_guide(r, c):
    "Return a new guide turtle of radius r and colour c"
    t = Turtle()
    t.speed("fastest")
    t.color(c)
    # Go to (r,0) without drawing
    t.penup()
    t.setposition(r,0)
    t.left(90)
    t.pendown()
    return t
Notice this function returns a turtle. Save and run, then try this in the shell:
>>> g = new_guide(100, "blue")
>>> p = g.position()
>>> g.circle(50, 90)
>>> q = g.position()
>>>
>>> mid = (1/2) * (p+q)
>>> setposition(mid)
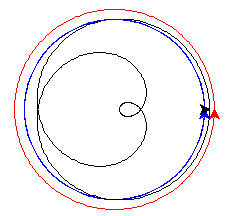
You should see this:
The unnamed turtle (black) has moved halfway between start and end of the blue arc.
Moving the guides
The first job is to make the guides move in their orbits. Add this to your program at the end:
def epitrochoid(a, b, L, M=1):
    ta = new_guide(a, "blue")
    tb = new_guide(b, "red")
    # N little steps s make one circle
    N = 500
    s = 360/N
    for i in range(N):
        # ta will go L times round
        ta.circle(a, L*s)
        # tb will go M times round
        tb.circle(b, M*s)

# Test
epitrochoid(90, 100, 3, 2)
Save and run. You should see blue and red circles drawn.
The blue turtle goes round L=3 times, and the red turtle M=2 times.
You can see how this works in the code.
N just has to be a big enough number to make the final curve smooth.
N steps of size s make 360 degrees, exactly one circle.
So N steps of L or M steps make L or M full circles.
M=1 on the first line says that,
if you don’t give it a value in the call to epitrochoid,
M will be equal to 1.
Compute the shape
The shape we are looking for is drawn by keeping our pen mid-way between the two guides.
Change the epitrochoid function to add these lines:
def epitrochoid(a, b, L, M=1):
    "Epitrochoid: a, b are guide radii; L, M the number of orbits."
    ta = new_guide(a, "blue")
    tb = new_guide(b, "red")
    # Local function for midpoint between the guides
    def midpoint():
        return (1/2) * (ta.position() + tb.position())
    # Set start position for unnamed turtle
    penup()
    setposition(midpoint())
    pendown()
    # N little steps s make one circle
    N = 500
    s = 360/N
    for i in range(N):
        # ta will go L times round
        ta.circle(a, L*s)
        # tb will go M times round
        tb.circle(b, M*s)
        # unnamed will be half-way between them
        setposition(midpoint())
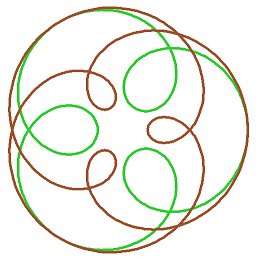
Save and run. You should see this:
Tidy up
It would be nice if the guide circles were not on the final drawing.
Add this tidy-up code at the end of epitrochoid,
and style the unnamed turtle to your liking:
def epitrochoid(a, b, L, M=1):

    ta = new_guide(a, "blue")
    tb = new_guide(b, "red")
    .
    .
    .
    # Erase guides
    guide_erase(ta)
    guide_erase(tb)

def guide_erase(t):
    "Erase what turtle t drew"
    t.hideturtle()
    t.clear()

speed("fastest")
width(5)
color("lime green")

# Test
epitrochoid(90, 100, 3, 2)

hideturtle()
Inspiring examples
Try changing the numbers in the call to epitrochoid like this:
a, b = 100, 300
epitrochoid(a, b, 4)
color("goldenrod")
epitrochoid(a, b, 5)
color("sienna")
epitrochoid(a, b, 6)
(Remember, M=1 if you don’t give a fourth argument.) Suppose you change just one line now:
a, b = -100, 300
and run again. When the loops point outwards, the shape is called a hypotrochoid.
What’s happening here?
a, b = 250, 300
epitrochoid(a, b, 4)
color("goldenrod")
epitrochoid(a, b, 5)
color("sienna")
epitrochoid(a, b, 6)
And what about here?
L = 6
a, x = 50, 80
epitrochoid(a, L*a, L)
color("goldenrod")
epitrochoid(a, L*a + x, L)
color("sienna")
epitrochoid(a, L*a - x, L)
Find other interesting shapes of your own.
Some advanced questions
If you like investigating mathematical patterns, this code project poses some interesting questions.
What determines the number of loops?
What values for
aandbmake the curve pass through (0,0)? (Hint: where would the guide turtles be at that moment?)
A shape in this family, where the curve passes through zero, is called a “rose”.
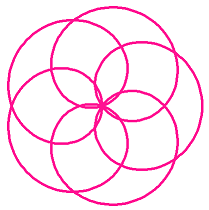
When do the loops become points?
Both curves below have 3 loops: what is the difference between them?